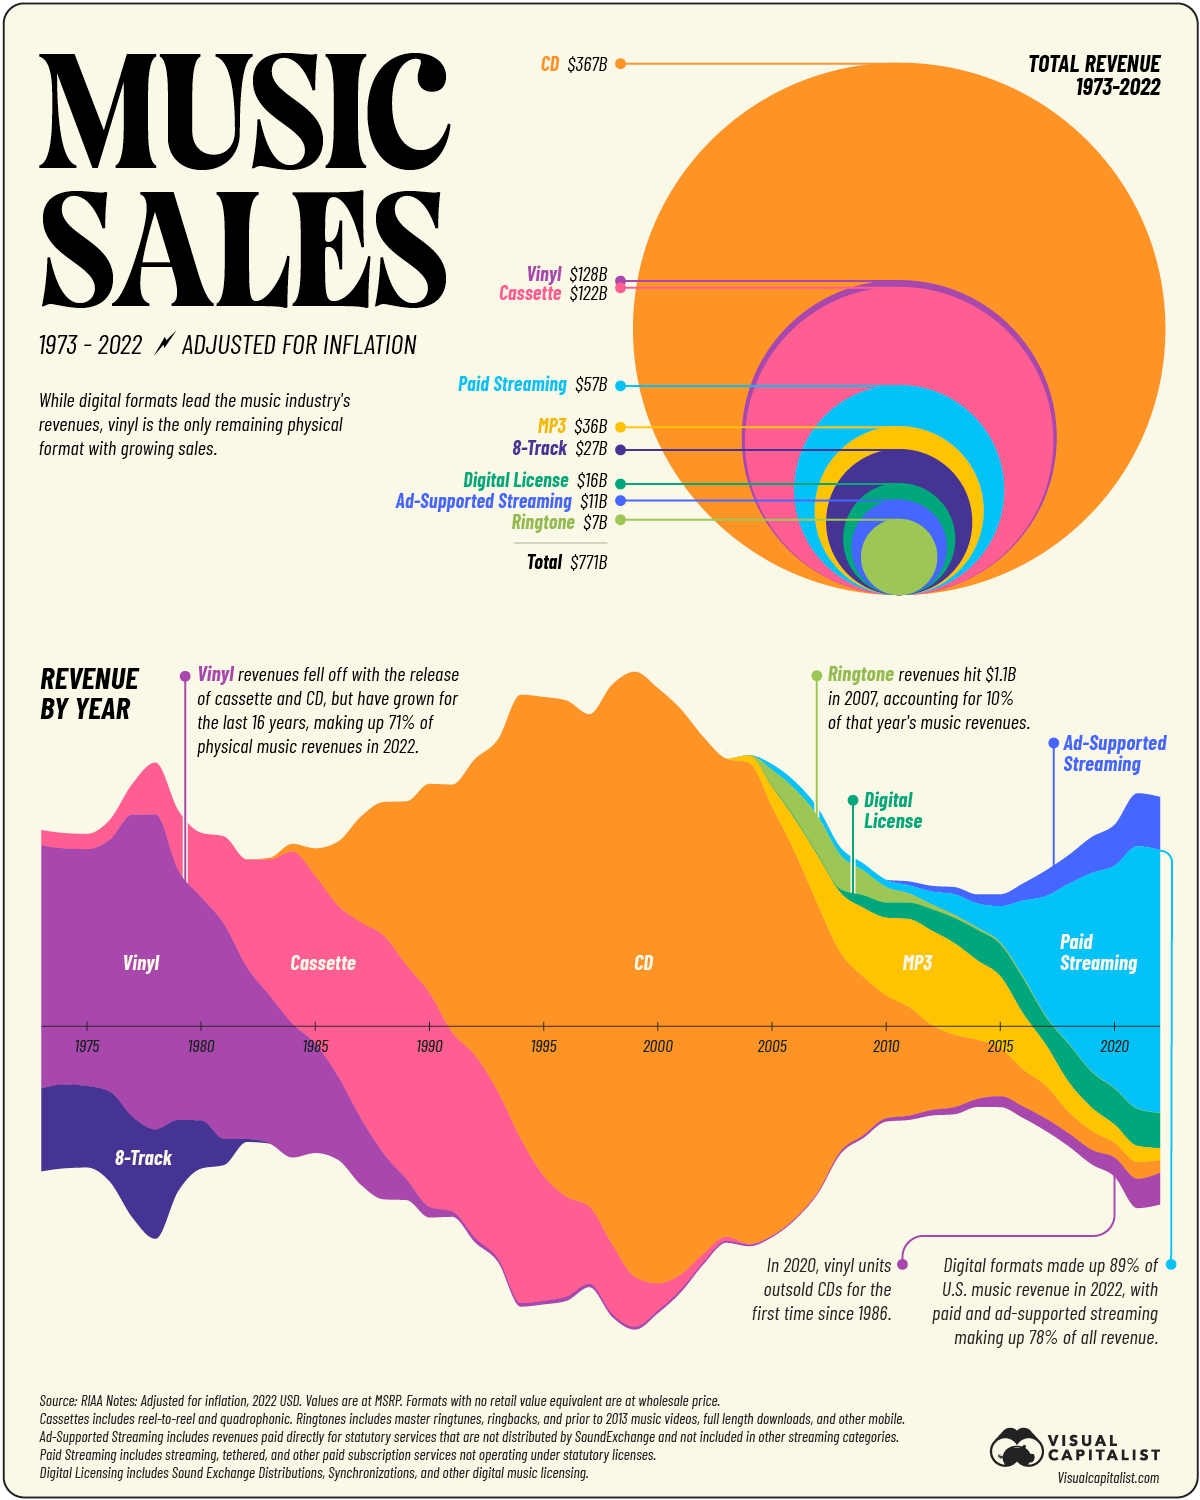
So the axis with the year isn’t actually 0 pr something else? Its just how much revenue was made in total (2000s were the time with most revenue) and how much each media contributed in a funky way of displaying it?
It would have been less confusing to have vertical lines rather than an x axis however they wanted it to look like a soundwave. However even though I am an electronic musician who works with soundwaves I didn’t notice the metaphor until reading the comment here.
Thanks for pointing that out. It is a bit like the distribution on a violin plot then. But it still is weird how the colors are distributed and albeit I think it does indeed look nice, I think this plot shouldn’t be in this community…