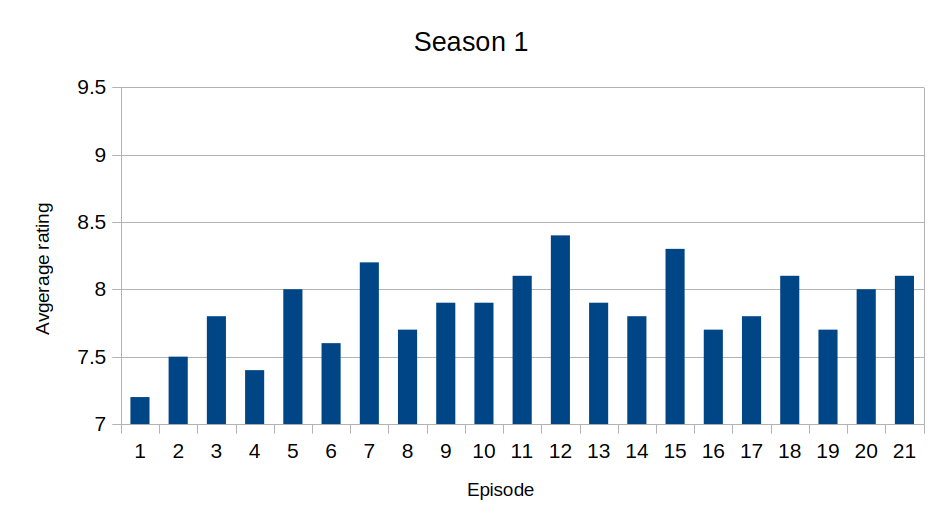
I couldn’t think of a single bad episode, so I was curious what other people thought was the worst. Both the pilot and the second Queen of Jordan were rated the worst, at 7.2. Still a pretty good rating!
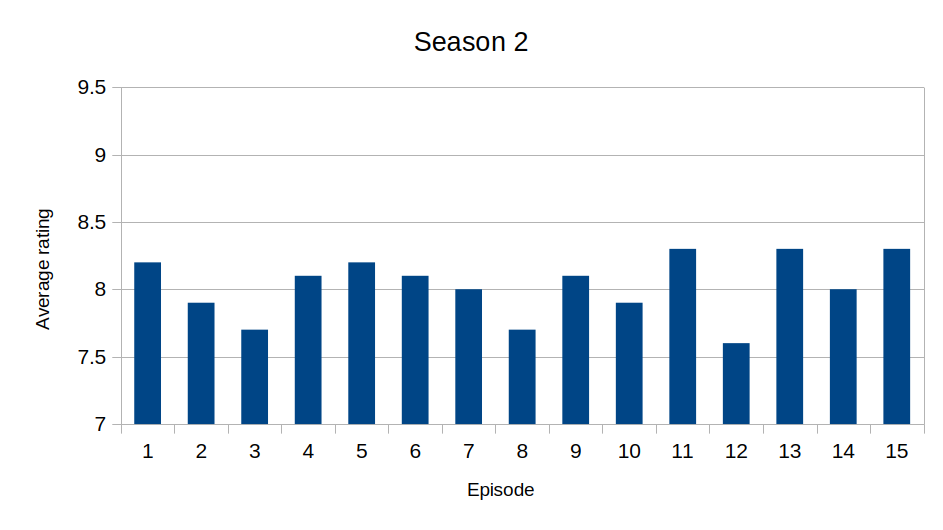
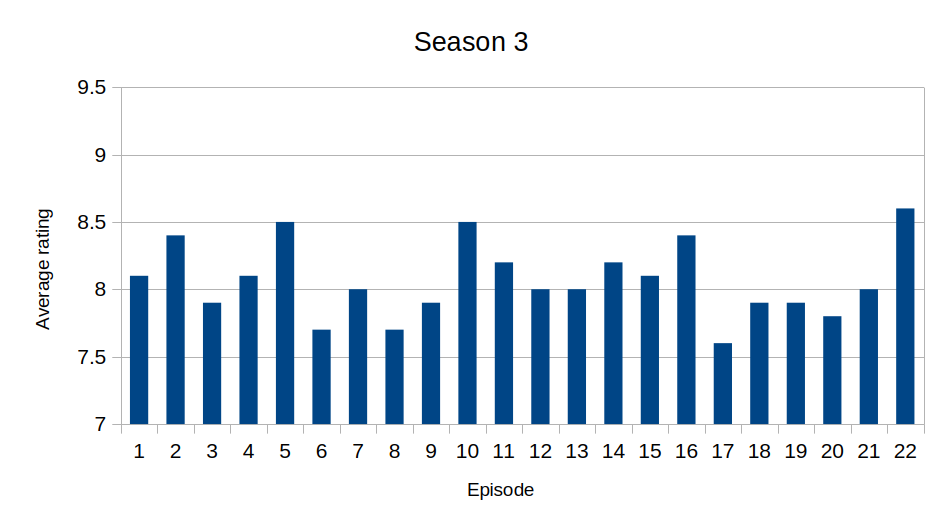
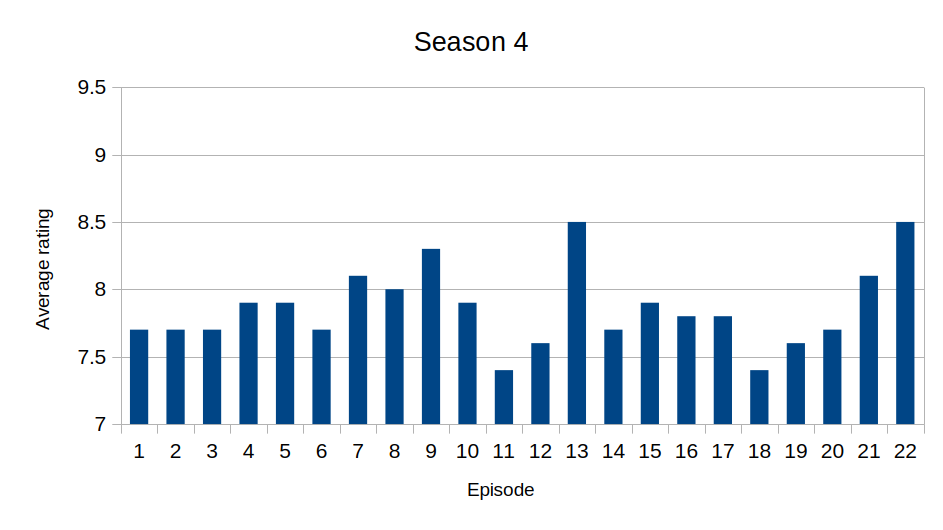
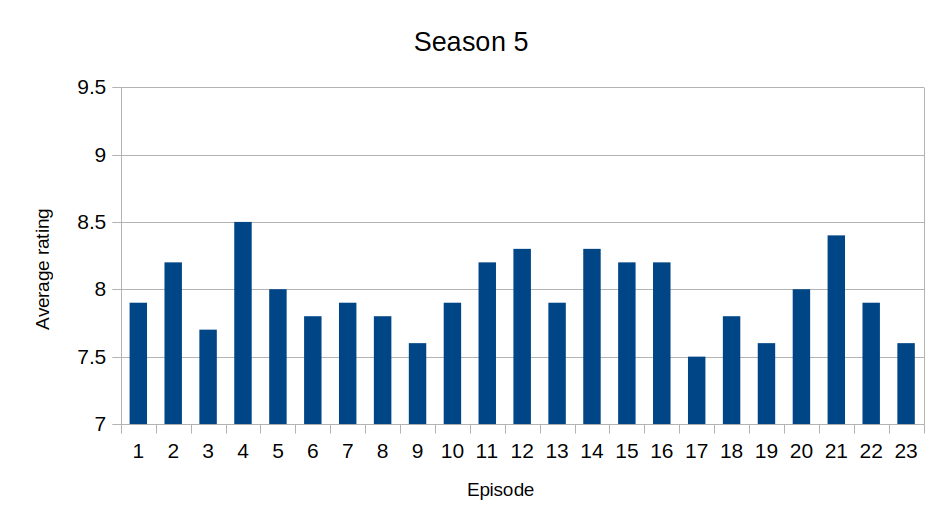
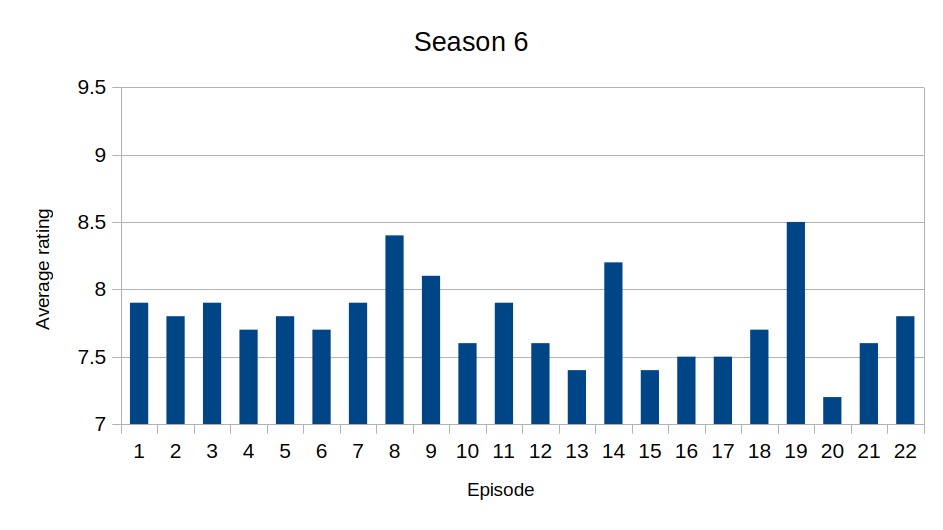
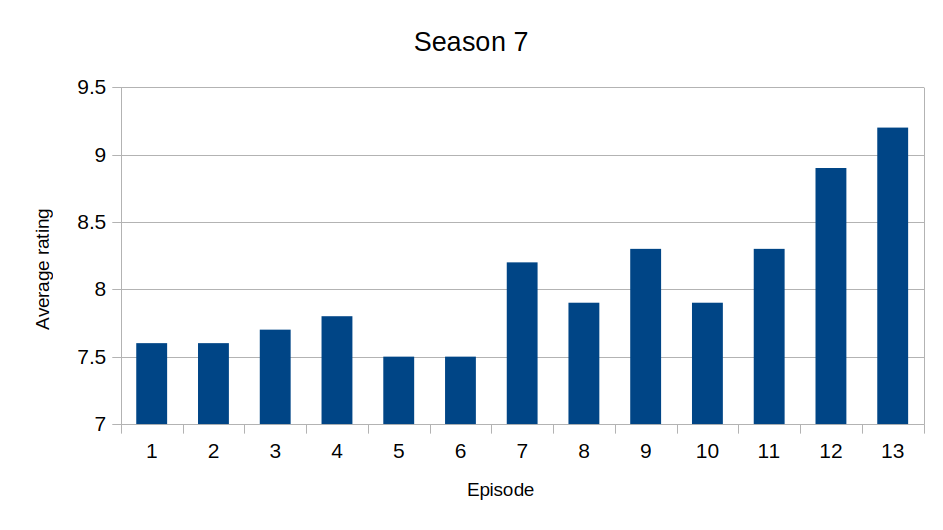
- Note that the Y axis on each chart does not go from 0-10. They are all 7-9.5.
- Data source: IMDb
- Tools used: LibreOffice Calc, GIMP
Season 1 chart
Season 2 chart
Season 3 chart
Season 4 chart
Season 5 chart
Season 6 chart
Season 7 chart
Raw data
| Season | Episode | Chronological | Name | Rating |
|---|---|---|---|---|
| 1 | 1 | 1 | Pilot | 7.2 |
| 1 | 2 | 2 | The Aftermath | 7.5 |
| 1 | 3 | 3 | Blind Date | 7.8 |
| 1 | 4 | 4 | Jack the Writer | 7.4 |
| 1 | 5 | 5 | Jack-Tor | 8.0 |
| 1 | 6 | 6 | Jack Meets Dennis | 7.6 |
| 1 | 7 | 7 | Tracy Does Conan | 8.2 |
| 1 | 8 | 8 | The Break-Up | 7.7 |
| 1 | 9 | 9 | The Baby Show | 7.9 |
| 1 | 10 | 10 | The Rural Juror | 7.9 |
| 1 | 11 | 11 | The Head and the Hair | 8.1 |
| 1 | 12 | 12 | Black Tie | 8.4 |
| 1 | 13 | 13 | Up All Night | 7.9 |
| 1 | 14 | 14 | The C Word | 7.8 |
| 1 | 15 | 15 | Hard Ball | 8.3 |
| 1 | 16 | 16 | The Source Awards | 7.7 |
| 1 | 17 | 17 | The Fighting Irish | 7.8 |
| 1 | 18 | 18 | Fireworks | 8.1 |
| 1 | 19 | 19 | Corporate Crush | 7.7 |
| 1 | 20 | 20 | Cleveland | 8.0 |
| 1 | 21 | 21 | Hiatus | 8.1 |
| 2 | 1 | 22 | Seinfeldvision | 8.2 |
| 2 | 2 | 23 | Jack Gets in the Game | 7.9 |
| 2 | 3 | 24 | The Collection | 7.7 |
| 2 | 4 | 25 | Rosemary’s Baby | 8.1 |
| 2 | 5 | 26 | Greenzo | 8.2 |
| 2 | 6 | 27 | Somebody to Love | 8.1 |
| 2 | 7 | 28 | Cougars | 8.0 |
| 2 | 8 | 29 | Secrets and Lies | 7.7 |
| 2 | 9 | 30 | Ludachristmas | 8.1 |
| 2 | 10 | 31 | Episode 210 | 7.9 |
| 2 | 11 | 32 | MILF Island | 8.3 |
| 2 | 12 | 33 | Subway Hero | 7.6 |
| 2 | 13 | 34 | Succession | 8.3 |
| 2 | 14 | 35 | Sandwich Day | 8.0 |
| 2 | 15 | 36 | Cooter | 8.3 |
| 3 | 1 | 37 | Do-Over | 8.1 |
| 3 | 2 | 38 | Believe in the Stars | 8.4 |
| 3 | 3 | 39 | The One with the Cast of ‘Night Court’ | 7.9 |
| 3 | 4 | 40 | Gavin Volure | 8.1 |
| 3 | 5 | 41 | Reunion | 8.5 |
| 3 | 6 | 42 | Christmas Special | 7.7 |
| 3 | 7 | 43 | Señor Macho Solo | 8.0 |
| 3 | 8 | 44 | Flu Shot | 7.7 |
| 3 | 9 | 45 | Retreat to Move Forward | 7.9 |
| 3 | 10 | 46 | Generalissimo | 8.5 |
| 3 | 11 | 47 | St. Valentine’s Day | 8.2 |
| 3 | 12 | 48 | Larry King | 8.0 |
| 3 | 13 | 49 | Goodbye, My Friend | 8.0 |
| 3 | 14 | 50 | The Funcooker | 8.2 |
| 3 | 15 | 51 | The Bubble | 8.1 |
| 3 | 16 | 52 | Apollo, Apollo | 8.4 |
| 3 | 17 | 53 | Cutbacks | 7.6 |
| 3 | 18 | 54 | Jackie Jormp-Jomp | 7.9 |
| 3 | 19 | 55 | The Ones | 7.9 |
| 3 | 20 | 56 | The Natural Order | 7.8 |
| 3 | 21 | 57 | Mamma Mia | 8.0 |
| 3 | 22 | 58 | Kidney Now! | 8.6 |
| 4 | 1 | 59 | Season 4 | 7.7 |
| 4 | 2 | 60 | Into the Crevasse | 7.7 |
| 4 | 3 | 61 | Stone Mountain | 7.7 |
| 4 | 4 | 62 | Audition Day | 7.9 |
| 4 | 5 | 63 | The Problem Solvers | 7.9 |
| 4 | 6 | 64 | Sun Tea | 7.7 |
| 4 | 7 | 65 | Dealbreakers Talk Show #0001 | 8.1 |
| 4 | 8 | 66 | Secret Santa | 8.0 |
| 4 | 9 | 67 | Klaus and Greta | 8.3 |
| 4 | 10 | 68 | Black Light Attack! | 7.9 |
| 4 | 11 | 69 | Winter Madness | 7.4 |
| 4 | 12 | 70 | Verna | 7.6 |
| 4 | 13 | 71 | Anna Howard Shaw Day | 8.5 |
| 4 | 14 | 72 | Future Husband | 7.7 |
| 4 | 15 | 73 | Don Geiss, America, and Hope | 7.9 |
| 4 | 16 | 74 | Floyd | 7.8 |
| 4 | 17 | 75 | Lee Marvin vs. Derek Jeter | 7.8 |
| 4 | 18 | 76 | Khonani | 7.4 |
| 4 | 19 | 77 | Argus | 7.6 |
| 4 | 20 | 78 | The Moms | 7.7 |
| 4 | 21 | 79 | Emmanuelle Goes to Dinosaur Land | 8.1 |
| 4 | 22 | 80 | I Do Do | 8.5 |
| 5 | 1 | 81 | The Fabian Strategy | 7.9 |
| 5 | 2 | 82 | When It Rains, It Pours | 8.2 |
| 5 | 3 | 83 | Let’s Stay Together | 7.7 |
| 5 | 4 | 84 | Live Show | 8.5 |
| 5 | 5 | 85 | Reaganing | 8.0 |
| 5 | 6 | 86 | Gentleman’s Intermission | 7.8 |
| 5 | 7 | 87 | Brooklyn Without Limits | 7.9 |
| 5 | 8 | 88 | College | 7.8 |
| 5 | 9 | 89 | Chain Reaction of Mental Anguish | 7.6 |
| 5 | 10 | 90 | Christmas Attack Zone | 7.9 |
| 5 | 11 | 91 | Mrs. Donaghy | 8.2 |
| 5 | 12 | 92 | Operation Righteous Cowboy Lightning | 8.3 |
| 5 | 13 | 93 | ¡Qué Sorpresa! | 7.9 |
| 5 | 14 | 94 | Double-Edged Sword | 8.3 |
| 5 | 15 | 95 | It’s Never Too Late for Now | 8.2 |
| 5 | 16 | 96 | TGS Hates Women | 8.2 |
| 5 | 17 | 97 | Queen of Jordan | 7.5 |
| 5 | 18 | 98 | Plan B | 7.8 |
| 5 | 19 | 99 | I Heart Connecticut | 7.6 |
| 5 | 20 | 100 | 100: Part 1 | 8.0 |
| 5 | 21 | 101 | 100: Part 2 | 8.4 |
| 5 | 22 | 102 | Everything Sunny All the Time Always | 7.9 |
| 5 | 23 | 103 | Respawn | 7.6 |
| 6 | 1 | 104 | Dance Like Nobody’s Watching | 7.9 |
| 6 | 2 | 105 | Idiots Are People Two! | 7.8 |
| 6 | 3 | 106 | Idiots Are People Three! | 7.9 |
| 6 | 4 | 107 | The Ballad of Kenneth Parcell | 7.7 |
| 6 | 5 | 108 | Today You Are a Man | 7.8 |
| 6 | 6 | 109 | Hey, Baby, What’s Wrong?: Part 1 | 7.7 |
| 6 | 7 | 110 | Hey, Baby, What’s Wrong?: Part 2 | 7.9 |
| 6 | 8 | 111 | The Tuxedo Begins | 8.4 |
| 6 | 9 | 112 | Leap Day | 8.1 |
| 6 | 10 | 113 | Alexis Goodlooking and the Case of the Missing Whisky | 7.6 |
| 6 | 11 | 114 | Standards and Practices | 7.9 |
| 6 | 12 | 115 | St. Patrick’s Day | 7.6 |
| 6 | 13 | 116 | Grandmentor | 7.4 |
| 6 | 14 | 117 | Kidnapped by Danger | 8.2 |
| 6 | 15 | 118 | The Shower Principle | 7.4 |
| 6 | 16 | 119 | Nothing Left to Lose | 7.5 |
| 6 | 17 | 120 | Meet the Woggels! | 7.5 |
| 6 | 18 | 121 | Murphy Brown Lied to Us | 7.7 |
| 6 | 19 | 122 | Live from Studio 6H | 8.5 |
| 6 | 20 | 123 | Queen of Jordan 2: The Mystery of the Phantom Pooper | 7.2 |
| 6 | 21 | 124 | The Return of Avery Jessup | 7.6 |
| 6 | 22 | 125 | What Will Happen to the Gang Next Year? | 7.8 |
| 7 | 1 | 126 | The Beginning of the End | 7.6 |
| 7 | 2 | 127 | Governor Dunston | 7.6 |
| 7 | 3 | 128 | Stride of Pride | 7.7 |
| 7 | 4 | 129 | Unwindulax | 7.8 |
| 7 | 5 | 130 | There’s No I in America | 7.5 |
| 7 | 6 | 131 | Aunt Phatso vs. Jack Donaghy | 7.5 |
| 7 | 7 | 132 | Mazel Tov, Dummies! | 8.2 |
| 7 | 8 | 133 | My Whole Life is Thunder | 7.9 |
| 7 | 9 | 134 | Game Over | 8.3 |
| 7 | 10 | 135 | Florida | 7.9 |
| 7 | 11 | 136 | A Goon’s Deed in a Weary World | 8.3 |
| 7 | 12 | 137 | Hogcock! | 8.9 |
| 7 | 13 | 138 | Last Lunch | 9.2 |
Separated by season, with seasonal averages
| Ep. # | Season 1 | Season 2 | Season 3 | Season 4 | Season 5 | Season 6 | Season 7 |
|---|---|---|---|---|---|---|---|
| 1 | 7.2 | 8.2 | 8.1 | 7.7 | 7.9 | 7.9 | 7.6 |
| 2 | 7.5 | 7.9 | 8.4 | 7.7 | 8.2 | 7.8 | 7.6 |
| 3 | 7.8 | 7.7 | 7.9 | 7.7 | 7.7 | 7.9 | 7.7 |
| 4 | 7.4 | 8.1 | 8.1 | 7.9 | 8.5 | 7.7 | 7.8 |
| 5 | 8.0 | 8.2 | 8.5 | 7.9 | 8.0 | 7.8 | 7.5 |
| 6 | 7.6 | 8.1 | 7.7 | 7.7 | 7.8 | 7.7 | 7.5 |
| 7 | 8.2 | 8.0 | 8.0 | 8.1 | 7.9 | 7.9 | 8.2 |
| 8 | 7.7 | 7.7 | 7.7 | 8.0 | 7.8 | 8.4 | 7.9 |
| 9 | 7.9 | 8.1 | 7.9 | 8.3 | 7.6 | 8.1 | 8.3 |
| 10 | 7.9 | 7.9 | 8.5 | 7.9 | 7.9 | 7.6 | 7.9 |
| 11 | 8.1 | 8.3 | 8.2 | 7.4 | 8.2 | 7.9 | 8.3 |
| 12 | 8.4 | 7.6 | 8.0 | 7.6 | 8.3 | 7.6 | 8.9 |
| 13 | 7.9 | 8.3 | 8.0 | 8.5 | 7.9 | 7.4 | 9.2 |
| 14 | 7.8 | 8.0 | 8.2 | 7.7 | 8.3 | 8.2 | |
| 15 | 8.3 | 8.3 | 8.1 | 7.9 | 8.2 | 7.4 | |
| 16 | 7.7 | 8.4 | 7.8 | 8.2 | 7.5 | ||
| 17 | 7.8 | 7.6 | 7.8 | 7.5 | 7.5 | ||
| 18 | 8.1 | 7.9 | 7.4 | 7.8 | 7.7 | ||
| 19 | 7.7 | 7.9 | 7.6 | 7.6 | 8.5 | ||
| 20 | 8.0 | 7.8 | 7.7 | 8.0 | 7.2 | ||
| 21 | 8.1 | 8.0 | 8.1 | 8.4 | 7.6 | ||
| 22 | 8.6 | 8.5 | 7.9 | 7.8 | |||
| 23 | 7.6 | ||||||
| Avg. | 7.9 | 8.0 | 8.1 | 7.9 | 8.0 | 7.8 | 8.0 |
How many episodes are rated the same?
| Rating | Frequency |
|---|---|
| 7.2 | 2 |
| 7.4 | 5 |
| 7.5 | 6 |
| 7.6 | 13 |
| 7.7 | 18 |
| 7.8 | 13 |
| 7.9 | 24 |
| 8.0 | 11 |
| 8.1 | 12 |
| 8.2 | 11 |
| 8.3 | 9 |
| 8.4 | 5 |
| 8.5 | 6 |
| 8.6 | 1 |
| 8.9 | 1 |
| 9.2 | 1 |


Stop making graphs that don’t start at 0, it’s good that at least they all start at the same value, but by cutting off the axis below 7 you are altering the presentation of the data to imply a larger variance than there actually was.
I think the real issue is probably more the simple fact that this is a bar graph and not a line graph. The point of these graphs is to compare each episode relative to each other, not to compare relative to zero. In that case, a line graph with a Y axis ranging from 7-9.5 makes sense.
Or I could just make this a triangle graph…
What’s a triangle graph…?
Still doesn’t make sense with the bottom cut off. Imagine it as comparing the height of a bunch of people, say Americans vs Asians just going for a large difference here, if you start the chart at 4 feet, then you are going to get a very different feel from it compared to one started at 0. It will imply a even larger difference than there is
Don’t trim your graphs.
Stop reading axis before drawing conclusions, it’s good that you saw the graph at all, but by cutting your attention short, you are altering the perception of the data to imply a larger misunderstanding than there actually was.
Without the axis it looks like some episodes had a rating of 1 and others a rating of 9 or 10.
If I don’t read the axis the conclusion is even worse!
At least I know where the zero index is if I check the axis.
Not reading the axis is the worst thing you could do for information literacy