
You must log in or # to comment.
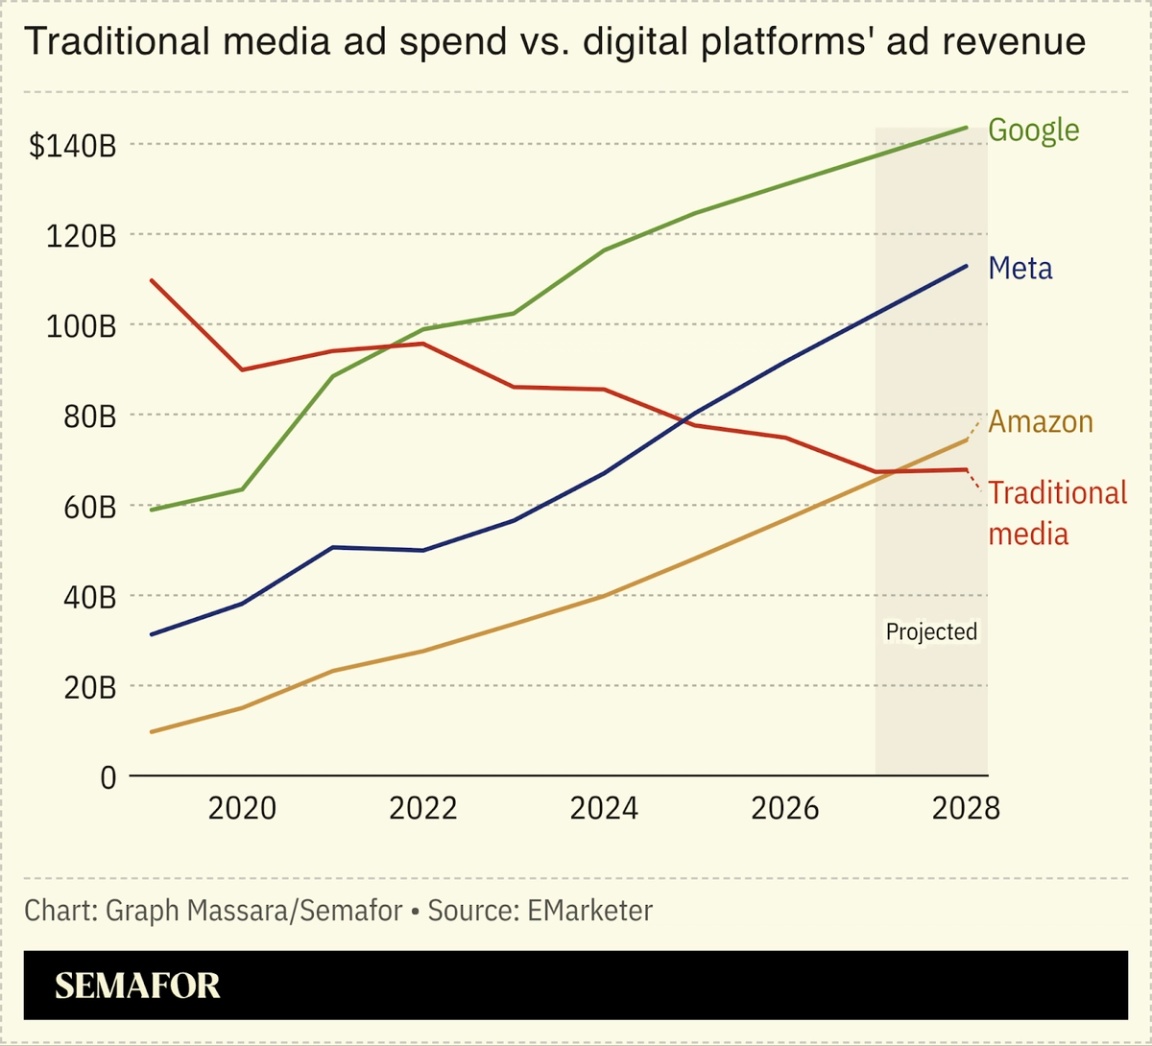
This is kinda shit graphic. A cumulative graph would be much more effective. And also disbelief about the total rise in revenue.
This is kinda shit graphic. A cumulative graph would be much more effective. And also disbelief about the total rise in revenue.
